
What Are Power BI Dashboard Consolidation Services for Manufacturing
Power BI dashboard consolidation services help manufacturing companies move from many disconnected reports to a compact, governed set of dashboards built on a single data model.
Instead of every plant, department or engineer building their own version of the truth, these services consolidate multiple Power BI dashboards into a unified, reliable view of performance.
In a typical manufacturing environment, data lives in multiple places, such as:
- ERP
- MES
- Quality systems
- Maintenance tools
- Spreadsheets
- Cloud services.
Over time, each team creates its own Power BI content.
This leads to overlapping dashboards, duplicated KPIs and inconsistent numbers in meetings.
Power BI dashboard consolidation services are designed to fix Power BI dashboard chaos by standardizing data, metrics and dashboards into one coherent reporting layer.
For manufacturers, this consolidation creates a single source of truth Power BI manufacturing environment that supports multi plant operations, cross functional visibility and consistent KPIs across Power BI dashboards.
What does Power BI consolidation involve?
At a high level, manufacturing dashboard consolidation in Power BI typically involves:
- Connecting and integrating data
- Transforming and modelling data into a unified structure
- Reducing the number of dashboards in Power BI:
- Power BI metric alignment for manufacturing KPIs
- Designing role based, consolidated dashboards
- Implementing sharing, security and governance
Together, these elements unify sales and production dashboards in Power BI, align operational and financial views and give manufacturers a stable foundation for analytics.
The result is a manufacturing reporting environment where people know which dashboards to use, trust the numbers they see and can make decisions faster across all sites.
In the next section, we’re breaking down how each of those services look like for your company in practice:
What Power BI Dashboard Consolidation Services Provide
Power BI dashboard consolidation services are a structured way to help you move from dealing with dashboard requests one by one to a repeatable framework for data, models and visuals that can scale across plants, regions and business units.
Here’s how we usually do it for our clients:
Data integration across manufacturing systems
The first capability is systematic data integration.
Services connect to the core systems that run manufacturing, for example:
- ERP systems for orders, inventory, cost and finance
- MES and production systems for line performance and downtime
- Quality and laboratory systems for defects and test results
- Maintenance and CMMS tools for work orders and asset health
- Supply chain and logistics tools for deliveries and lead times
- CRM or sales platforms for demand and pipeline
Instead of each dashboard using its own direct connection, consolidation creates a set of governed dataflows, Fabric or Azure pipelines and shared datasets.
This is the foundation that allows you to consolidate multiple Power BI dashboards without duplicating effort or logic in every report.
Data transformation and unified modelling
Once data is connected, services focus on cleaning and shaping it into a consistent structure. Typical activities include:
- Standardizing plant, line and machine identifiers
- Harmonizing product hierarchies, customer structures and calendars
- Handling messy operational tables, such as unpivoting log data and appending similar tables from multiple sites
- Defining a reusable semantic model that exposes clean tables for production, quality, maintenance, inventory and finance
Power Query and modelling best practices are used so that key manufacturing KPIs are calculated centrally.
Throughput, OEE, scrap, yield, on time delivery and lead time are implemented once in the model, not differently in every report.
Custom, role based dashboard development
Consolidation services then turn that model into a focused set of dashboards. Instead of many overlapping pages, you get a planned suite, such as:
- Plant operations dashboards for line and shift level performance
- Quality and scrap dashboards for engineers and quality managers
- Maintenance and reliability dashboards for asset owners
- Supply chain and inventory views for planners
- Executive and regional performance apps for leadership
Layouts, visuals and navigation are designed so that users can reach key information in a few clicks.
For example, in one manufacturer that ships primarily by rail, we replaced several spreadsheets and local trackers with a single Fleet Status dashboard that shows inbound, outbound and unavailable railcars by site, with trends and a simple table for today, 7 day and 90 day averages.

This is where you actively reduce the number of dashboards in Power BI and move toward a smaller, strategic set of views that people actually use.
Advanced analytics and metric alignment
On top of the model, services implement DAX measures and calculations. The goal is Power BI metric alignment for manufacturing KPIs, so that OEE, scrap rate or downtime have one agreed definition across all plants and dashboards. Typical work includes:
- Standard measures for core KPIs across operations, quality, maintenance and finance
- Trend, variance and benchmark measures to compare plants, lines and products
- Calculations that support forecasting or capacity scenarios where appropriate
This alignment is what creates consistent KPIs across Power BI dashboards and reduces disputes about which number is correct.
Report sharing, security and governance
Another key deliverable is a clear structure for how reports are published and accessed. Consolidation services typically provide:
- Standardized workspaces and Power BI apps for executives, plants and functions
- Row level security for plants, regions or business units
- Rules for who can create, modify and publish dashboards
- A simple process for retiring legacy reports and preventing new dashboard chaos
This governance is essential to fix Power BI dashboard chaos long term, rather than only solving it once.
Automation, efficiency and system consolidation
Finally, services focus on automation and operational efficiency. Scheduled refresh, standardized dataflows and shared datasets replace manual exports and ad hoc file based reporting. Where relevant, data from financial or ERP systems such as Dynamics, SAP or Xero is consolidated with production data.

Because all rail movements and costs now flow into the same model, we could build an Empty and Loaded Railcars view that quantifies margin loss from empty moves and container shortages by month and site.
This makes it possible to unify sales and production dashboards in Power BI and to support scenarios like margin by product, order promise accuracy or cost per unit by line.
Together, these capabilities form a complete Power BI report rationalization service for manufacturers.
You end up with fewer, better dashboards on top of a single, governed model that supports reliable decision making across the whole manufacturing organization.
How Power BI Dashboard Consolidation Works in Manufacturing
Power BI dashboard consolidation in manufacturing follows a structured sequence of steps. The goal is to move from fragmented reports to a governed environment where a small, standardized suite of dashboards sits on top of a single, trusted model.
Here’s a process we recommend to our clients:
1. Discover existing reports and understand the current state
Consolidation starts with understanding what exists today. Before you consolidate multiple Power BI dashboards, you need a clear inventory.
Typical activities include:
- Listing all Power BI reports, dashboards, datasets and workspaces in use across plants, regions and departments
- Identifying which reports are used regularly, which are rarely opened and which are duplicates
- Mapping each report to its business purpose, process and KPI owner
- Documenting known issues such as slow refresh, inconsistent numbers or unreliable data sources
This discovery phase exposes where Power BI dashboard chaos is coming from. You see how many dashboards are trying to answer similar questions with different logic, and where you can reduce the number of dashboards in Power BI without losing value.
2. Connect to and rationalize data sources
Next, services standardise how data is accessed. Instead of every report connecting directly to ERP, MES or spreadsheets, you move towards governed data connections.
Typical work here:
- Identify all source systems. ERP, MES, historians, quality, maintenance, supply chain, finance, CRM
- Replace ad hoc connections with standard dataflows, Fabric pipelines or Azure data services
- Set clear rules for where production data, master data and reference data should come from
This step is about building the foundation for a single source of truth Power BI manufacturing setup, where all consolidated dashboards draw their data from the same, well defined pipelines.
3. Transform, standardize and model data
Once connections are in place, the focus shifts to data shaping and modelling. Power Query and modelling practices are used to turn raw tables into a unified semantic model.
Key tasks:
- Clean and transform operational data. unpivot logs, append similar tables from different plants, standardise codes
- Align plant, line, machine, product and customer identifiers across systems
- Define a common calendar and time intelligence logic
- Build a reusable model with related tables for production, quality, maintenance, inventory, orders and finance
At this stage, core manufacturing KPIs are defined centrally. OEE, scrap rate, yield, throughput, downtime and on time delivery are implemented as DAX measures in the model. This is where power BI metric alignment for manufacturing KPIs starts to happen.
4. Build relationships, measures and a governed semantic layer
With clean tables in place, services formalise relationships and measures. The aim is to create a semantic layer that all reports can reuse.
Typical outcomes:
- A consistent set of relationships between fact tables and dimensions such as date, plant, product, customer and asset
- A catalogue of DAX measures for operational and financial KPIs, shared across all dashboards
- Standardised filters and time frames so that comparisons between sites and periods are meaningful
This governed layer is at the core of power BI report rationalization services. It ensures that every consolidated dashboard uses the same definitions, which directly supports consistent KPIs across Power BI dashboards.
5. Design the future state dashboard suite and navigation
Only after the data and model foundation is stable do you redesign the dashboards themselves. The goal is to fix Power BI dashboard chaos by replacing many overlapping reports with a planned suite.
Typical design outputs:
- A small set of strategic dashboards. executive, plant performance, operations, quality, maintenance, supply chain, finance
- Clear decisions about which KPIs belong in which dashboard and at what level of detail
- Navigation paths that let users move from summary to detail in a few clicks
- Role based views for plant managers, supervisors, engineers, analysts and executives
This is the stage where you visibly consolidate multiple Power BI dashboards into a coherent structure that covers the main manufacturing questions without redundancy.
6. Publish, secure and govern the consolidated environment
Once the consolidated dashboards are built, they are published in a controlled way.
Typical elements
- Use of standard workspaces and Power BI apps for plants, regions and leadership
- Row level security so users only see relevant plants, lines or business units
- Governance rules that define who can create, modify and retire dashboards
- Monitoring of usage to ensure new dashboards are not reintroducing sprawl
These measures ensure that manufacturing dashboard consolidation in Power BI is sustainable, not a one off clean up.
7. Pilot, refine and roll out across sites
Finally, consolidation is rolled out in phases.
Our approach:
- Pilot the new model and dashboards with one or two plants or regions
- Gather feedback on KPIs, layouts and navigation and refine the solution
- Extend to additional plants and functions once the design is validated
- Provide training, documentation and a support model for ongoing enhancements
By following these steps, manufacturers move from a fragmented reporting landscape to a unified environment.
For our clients, this means they use fewer, higher value dashboards on top of a single, governed model that supports reliable decisions across all sites.
Dashboard Chaos in Manufacturing: Problems Before Consolidation
Before consolidation, many manufacturing organisations live with a cluttered Power BI environment.
Over time, what started as a handful of useful reports became a large collection of overlapping dashboards, each showing a slightly different version of performance.
Proliferation of dashboards across plants and departments
In most cases, every plant, department or power user builds their own reports.
We see a few common patterns across companies we work with, such as:
- Separate dashboards for production, maintenance, quality and supply chain, all built in isolation
- Local variations at each site, for example one plant’s OEE report versus another plant’s version
- Individual engineers creating one off dashboards to answer specific questions that later become semi official
This leads to a large, unplanned catalogue of reports that is difficult to navigate.
Users are not sure which dashboard is the right one for a given question, and IT teams struggle to reduce the number of dashboards in Power BI without breaking someone’s local solution.
Conflicting KPIs and inconsistent definitions
Without a governed model, KPIs are often calculated differently in each report. It has several consequences:
- OEE defined with different availability, performance or quality formulas by plant or department
- Scrap rate, yield or on time delivery calculated with different filters or time periods
- Finance and operations using different logic for revenue, margin or cost per unit
From our conversations with different teams, the biggest problem is spending time in meetings reconciling numbers rather than discussing actions.
Everyone trusts a different number – and that means a longer time to meaningful decisions.
Hidden technical debt and fragile reports
Dashboard chaos also creates technical and operational risks, such as:
- Many reports connecting directly to operational systems, Excel files or shared folders
- Duplicate datasets and complex report level measures that are hard to maintain
- Slow refresh times, broken queries and frequent support tickets for the BI or IT team
Instead of working on improvements, analytics teams spend time firefighting issues and manually fixing reports.
New dashboards are layered on top of old ones rather than retiring outdated content, which increases technical debt.
Poor user experience and low adoption
From an end user perspective, the environment becomes confusing:
- Long lists of workspaces and dashboards with similar names
- Multiple links circulating for “the same” KPI, with no clear indication of which one is official
- Executives receiving slide exports and screenshots, because no one is confident enough in the live dashboards
This reduces trust and adoption. Users rely on local spreadsheets or presentations instead of using Power BI as the central reporting platform.
As you can see, these problems form the starting point for power BI dashboard consolidation services. Now, let us show you how we fix it for our clients:
Service Components of a Manufacturing Dashboard Consolidation Project
A manufacturing focused Power BI dashboard consolidation project is typically structured into a set of repeatable service components. Together they provide a practical way to consolidate multiple Power BI dashboards, reduce the number of dashboards in Power BI and move toward a single source of truth Power BI manufacturing environment.
Inventory and assessment of existing dashboards
The starting point is a structured inventory. Our Power BI report rationalization services begin by making the current landscape visible. This means:
- Extracting a list of all Power BI dashboards, reports, datasets and apps across plants, functions and regions
- Analysing usage to see which reports are actually opened and which are effectively unused
- Identifying duplicates, near duplicates and dashboards that try to answer the same questions with different logic
- Mapping each report to its business process, KPI owners and primary users
- Flagging known issues such as unreliable data sources, slow refresh or broken visuals
This phase provides a factual basis for decisions about which content to keep, which to merge and which to retire.
It also surfaces where Power BI dashboard chaos is most severe and where consolidation will have the greatest impact.
KPI and metric alignment across functions and plants
Once the current landscape is understood, the focus shifts to metrics. Power BI metric alignment for manufacturing KPIs is central to achieving consistent KPIs across Power BI dashboards.
This step usually involves:
- Workshops with stakeholders from operations, quality, maintenance, supply chain, finance and sales
- Documenting current KPI definitions, including formulas, filters, thresholds and time frames
- Identifying differences in how plants calculate OEE, scrap rate, yield, downtime or on time delivery
- Agreeing standard definitions that can be applied across all sites and functions
- Deciding which metrics should be corporate level standards and which can remain local or plant specific
The output is a set of agreed KPI definitions that will later be implemented in the Power BI data model. This alignment is what ensures that when two dashboards show OEE, they are using the same logic.
Future state dashboard suite and navigation design
With the inventory and metric alignment in place, we define the target state. Our goal is a compact, coherent dashboard suite that supports manufacturing decision making at different levels.
Typical design activities:
- Grouping requirements into a small set of strategic dashboards, for example executive performance, regional or corporate overview, plant performance, production operations, quality, maintenance, supply chain and finance
- Deciding which KPIs and views belong in which dashboard and at what level of detail
- Designing navigation so users can move from summary to detail in a few clicks, for example executive view to plant view, plant view to line or machine view
- Clarifying which dashboards are global standards and which are optional or local variants
This design work defines how manufacturing dashboard consolidation in Power BI will look once implemented. It is where you explicitly plan to consolidate multiple Power BI dashboards into a smaller, standardized set.
Power BI model and architecture redesign
After the target suite is defined, the underlying data model and architecture are redesigned to support it. This is where the technical foundation for single source of truth Power BI manufacturing reporting is created.
Common tasks include:
- Moving calculations from individual reports into centralised Power BI datasets and a reusable semantic layer
- Implementing shared datasets that can be reused by multiple dashboards instead of each report having its own model
- Standardising dataflows, Fabric or Azure pipelines so all dashboards use the same data ingestion and transformation logic
- Simplifying and consolidating tables to reduce complexity and remove duplicated logic
- Addressing performance issues by optimising model design, partitioning and refresh strategies
As a result, new and existing dashboards draw from the same set of well defined tables and measures rather than implementing their own logic.
Build, rollout and enablement of consolidated dashboards
The final component is the practical build and rollout of the new environment. This is where we replace the fragmented set that existed before with the planned suite of dashboards.
Key elements:
- Developing the new standard dashboards using agreed UX patterns, layouts and visual standards
- Implementing row level security and role based access for plants, regions, business units and functions
- Piloting the consolidated dashboards with selected plants or user groups, gathering feedback and refining content
- Rolling out to additional sites once the design is validated
- Training power users and key stakeholders on how to use, interpret and extend the new dashboards
- Providing documentation that describes KPI definitions, data lineage and dashboard ownership
This phase can also include use cases that unify sales and production dashboards in Power BI, by combining ERP or CRM data with production performance so commercial and operations teams view a consistent picture.
Governance and ongoing improvement
To ensure that consolidation is sustainable, our projects typically include governance and continuous improvement mechanisms, such as:
- Rules for creating, modifying and retiring dashboards, so new content does not recreate sprawl
- Ownership assignments for key datasets, metrics and dashboards
- Regular reviews of usage data to identify redundant content and opportunities for further simplification
- A backlog process for new requirements that ensures they align with the existing model and suite
Together, these service components connect strategic alignment of KPIs with technical redesign and user adoption, so the environment moves from chaotic and fragmented to stable and governed.
Next, we’ll show you how we apply those steps in different scenarios:
Manufacturing Use Cases: Consolidating Multiple Power BI Dashboards
Manufacturing organisations often recognise the value of consolidation when they see similar patterns of dashboard sprawl across plants, functions and management levels.
The following use cases show how Power BI dashboard consolidation services can fix Power BI dashboard chaos in practical, focused ways.
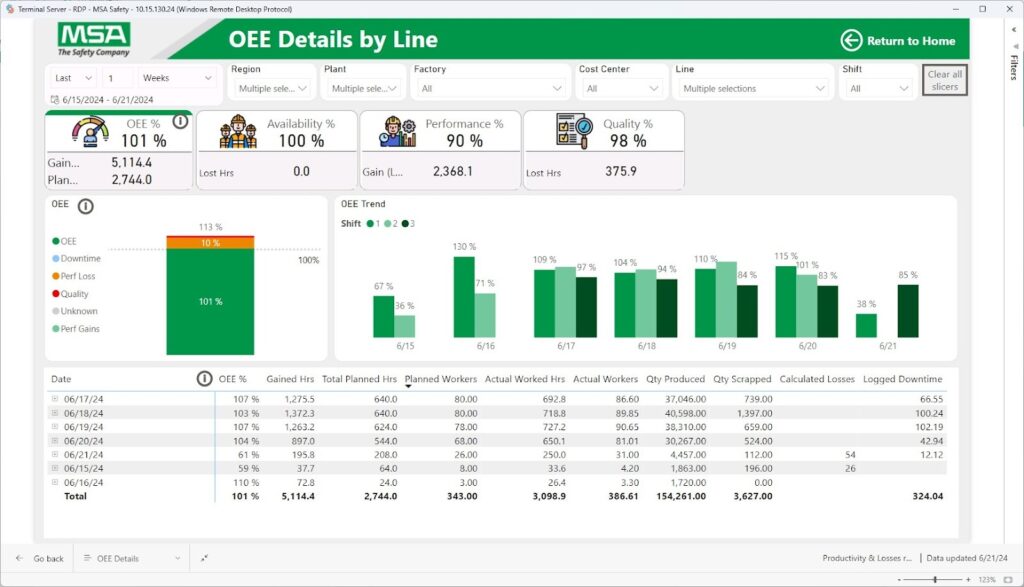
Use case 1. Operations. From 50 plus production dashboards to one operations suite
Many plants accumulate tens of separate dashboards for downtime, throughput, changeovers, scrap and shift performance. Each was created for a specific request, with its own filters, calculations and visuals.
How we typically consolidate them:
- Inventory all existing production dashboards and groups them by question or decision they support
- Identify overlaps and conflicting logic for OEE, throughput, availability and scrap
- Move KPI definitions into a central model and removes duplicated report level measures
- Design a single operations suite with pages for downtime, throughput, scrap and capacity, with drill through to line and machine
Here’s how a consolidated report looks like for our client, MSA:

Thanks to this, operators, supervisors and plant managers use the same set of dashboards to monitor production instead of jumping between dozens of different reports.
Use case 2. Plant performance. Unifying maintenance, production and quality views
In many factories, production, maintenance and quality teams each build their own dashboards. Maintenance looks at work orders and MTBF, quality monitors defects and scrap, production tracks output and schedule adherence. Each uses different data sources and KPI definitions.
How we tackle it:
- Connect to maintenance, quality and production systems using shared dataflows and a unified model
- Align KPIs around downtime, root causes, defect categories and rework
- Build a plant performance dashboard that surfaces a joined up view of output, quality and asset reliability
- Provide drill downs that still let each function analyse its own detail

This approach helps consolidate multiple Power BI dashboards into a single plant performance view that supports cross functional problem solving instead of siloed conversations.
Use case 3. Multi site KPI alignment across regions
Global or multi site manufacturers often discover that each plant has its own version of OEE, scrap rate or yield. Regional leaders cannot easily compare performance because every dashboard is built differently.
Our consolidation project in this context usually:
- Documents how each site currently calculates key KPIs
- Agrees standard definitions for corporate KPIs that must be consistent everywhere
- Implements these as central DAX measures in a shared semantic model
- Replaces legacy dashboards with a standard OEE and performance app that every plant uses
This creates consistent KPIs across Power BI dashboards and gives leadership a reliable basis for benchmarking plants and lines.
Use case 4. Commercial and operations. Unify sales and production dashboards in Power BI
Sales and operations often maintain separate reporting worlds. Sales teams focus on pipeline and orders. operations focus on capacity, throughput and inventory. Without a consolidated view, it is hard to see whether production can actually meet demand.
Consolidation work in this area typically:
- Integrates CRM and ERP sales data with production and inventory data in one model
- Defines shared metrics such as order coverage, promise accuracy and fill rate
- Builds dashboards that show demand, supply and capacity on a single canvas
- Provides filtered views for commercial teams and operations while keeping a common data foundation
Here’s a real-life example:

Commercial teams see the same data in a Customer Shipment and Release view, which shows cars at customer, shipped cars and hold time by account. Both dashboards sit on the same model, so sales, supply chain and operations literally see the same numbers.
We unify sales and production dashboards in Power BI so both sides see the same numbers when discussing order commitments, lead times and customer promises.
Use case 5. Executive reporting. From many links and exports to one Power BI app
At executive level, it is common to see a mixture of slide decks, Excel extracts and links to several dashboards covering finance, operations and quality. Leaders spend time switching between sources and resolving conflicting metrics.
Our Power BI dashboard consolidation services typically
- Identify which KPIs executives really need on a weekly or monthly basis
- Align these KPIs with the consolidated operational and financial models
- Create a single executive Power BI app with curated pages for financials, plant performance, quality and strategic initiatives
- Retire redundant reports and encourage the use of the app as the official source
This reduces the number of dashboards in Power BI that leadership needs to remember and provides a single source of truth Power BI manufacturing view for strategic decisions.
Outcomes of Power BI Dashboard Consolidation for Manufacturing
After consolidation, manufacturers usually see a clear shift from fragmented reporting to a single source of truth Power BI manufacturing environment. This means:
- Fewer dashboards, higher adoption: A compact suite of standard dashboards replaces dozens or hundreds of overlapping reports. Users know which dashboards to open for which decisions. Adoption increases because navigation is simpler and content is clearly owned.
- Consistent KPIs across Power BI dashboards: KPI definitions move into the shared model. OEE, scrap rate, yield, downtime and on time delivery are calculated once and reused everywhere. Meetings spend less time reconciling numbers and more time discussing actions.
- Reduced effort to find the “right” report: With a clear dashboard map and standard apps, users spend less time hunting through workspaces and links. Plant managers, supervisors and executives have defined entry points into the data they need.
- Lower maintenance cost and technical debt: Shared datasets, standard dataflows and a governed semantic layer reduce duplication. BI and IT teams maintain fewer models and reports, with fewer breakages and less manual rework.
- Faster onboarding of new users: New staff only need to learn a small set of consolidated dashboards. KPI documentation and consistent layouts make it easier to understand and trust the numbers.
These outcomes together improve the reliability and speed of manufacturing decisions across plants, regions and functions.
How Simple BI Works With Manufacturers
Simple BI typically structures dashboard consolidation in three stages. Each stage has a clear focus and deliverables.
- Assessment phase
- Inventory existing Power BI content and key data sources
- Identify dashboard chaos hotspots and consolidation opportunities
- Understand pain points from both business and IT perspectives
- Propose a future dashboard map and high level architecture for a single source of truth
- Consolidation project
- Align manufacturing KPIs and agree standard definitions across functions and sites
- Redesign Power BI models and data pipelines to support shared datasets and a governed semantic layer
- Design and build the consolidated dashboard suite, including executive, plant and functional views
- Implement row level security, apps and governance rules for publishing, ownership and retirement
- Ongoing support
- Optional managed analytics services to keep the environment healthy
- Support for new use cases that reuse the existing model rather than adding new silos
- Periodic reviews to ensure the number of dashboards in Power BI remains under control
We aim to keep the project anchored in business outcomes while addressing the technical foundations required for sustainable consolidation.
Fix Your Power BI Dashboard Chaos
If you recognise the symptoms of dashboard sprawl in your manufacturing environment, there are two straightforward ways to move forward:
Book a Power BI dashboard consolidation call: Use this session to review your current landscape, discuss specific issues around KPIs, plants and systems, and explore what a consolidation project could look like for your organisation.
Both entry points connect back to Simple BI’s broader Power BI consulting for manufacturing services. From there, you can move from isolated dashboards and conflicting KPIs to a stable, governed Power BI environment that supports consistent, plant wide and enterprise wide decision making.